


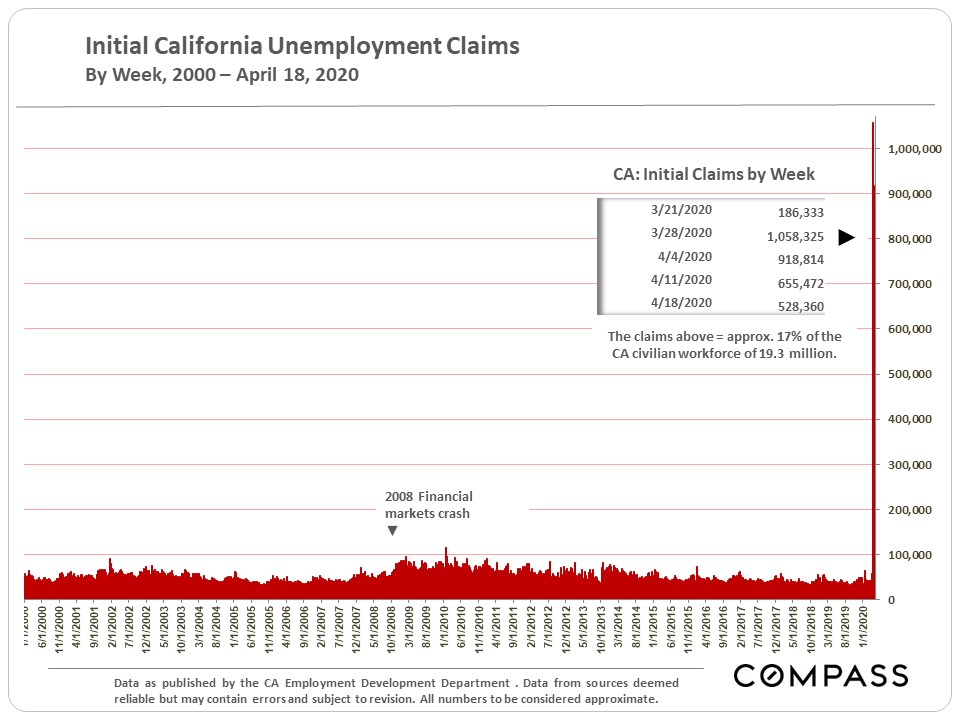
Around the Bay Area, condo markets have typically been softer than house markets since shelter-in-place first came into effect…

Check out the latest market data for the East Bay!
We love to keep our local community informed on the latest market trends, data and real estate stats. 🏡🏡🏡
Here is the latest data, numbers, and housing market charts for May 2023. If you have any questions, feel free to give me a call or shoot me a quick email. I am always happy to help.
Mother’s Day is coming up and Mom deserves a wonderful day full of love, kisses and some extra attention.
Here are some great ways you can celebrate Mom in the East Bay.
Wondering how to make Mother’s Day special? Here are a few local businesses that the Simone Koga Group has curated to make sure you have a memorable holiday with Mom.
|
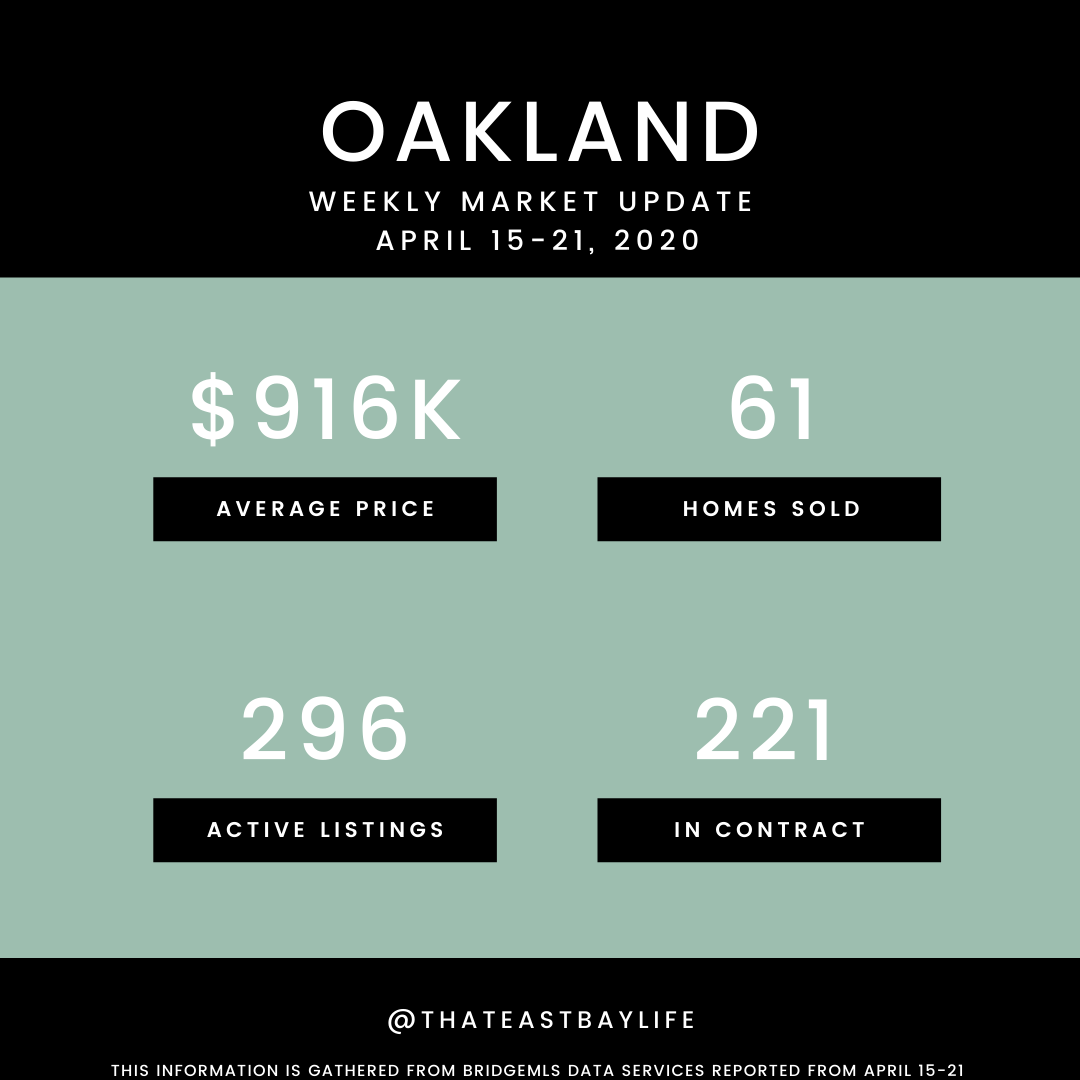
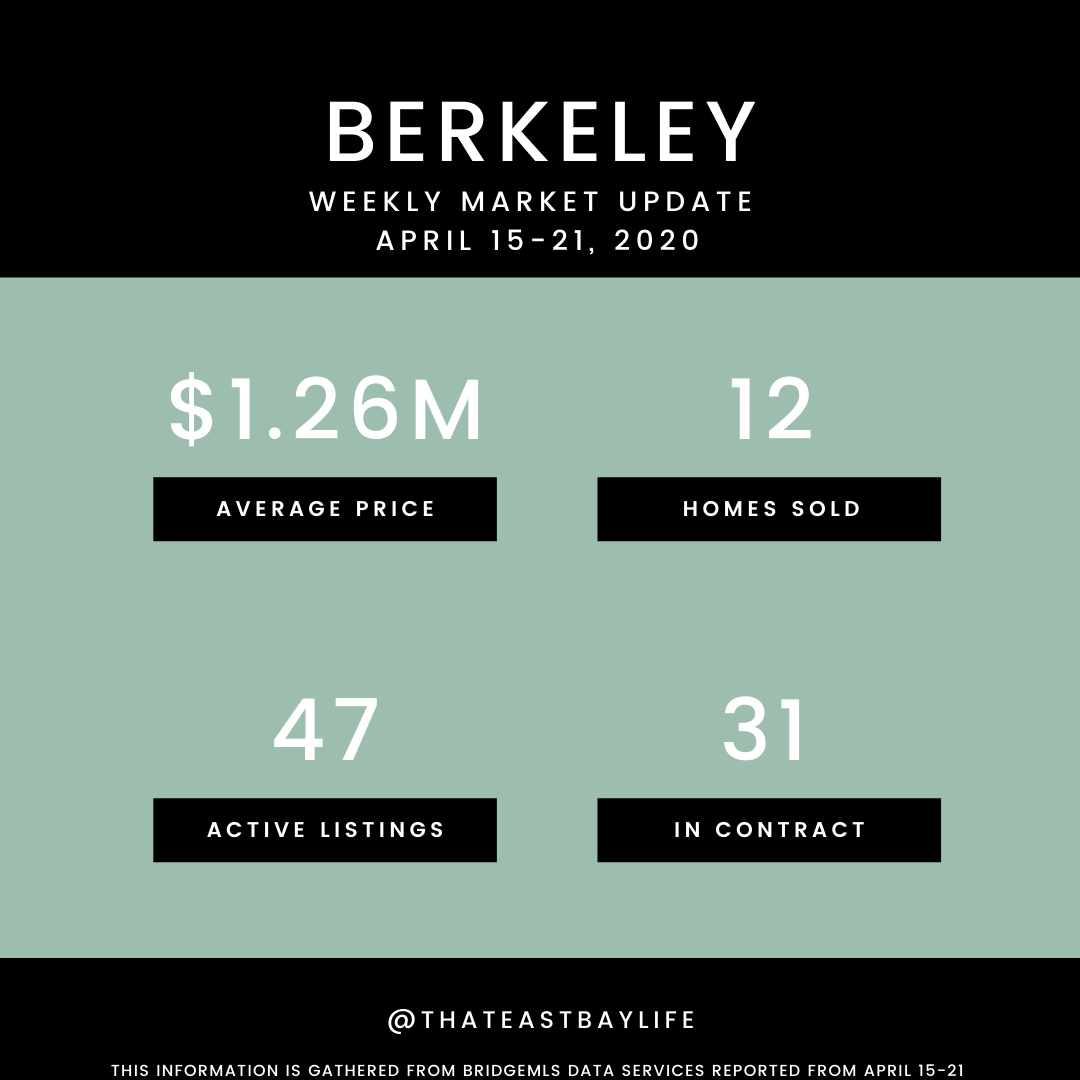
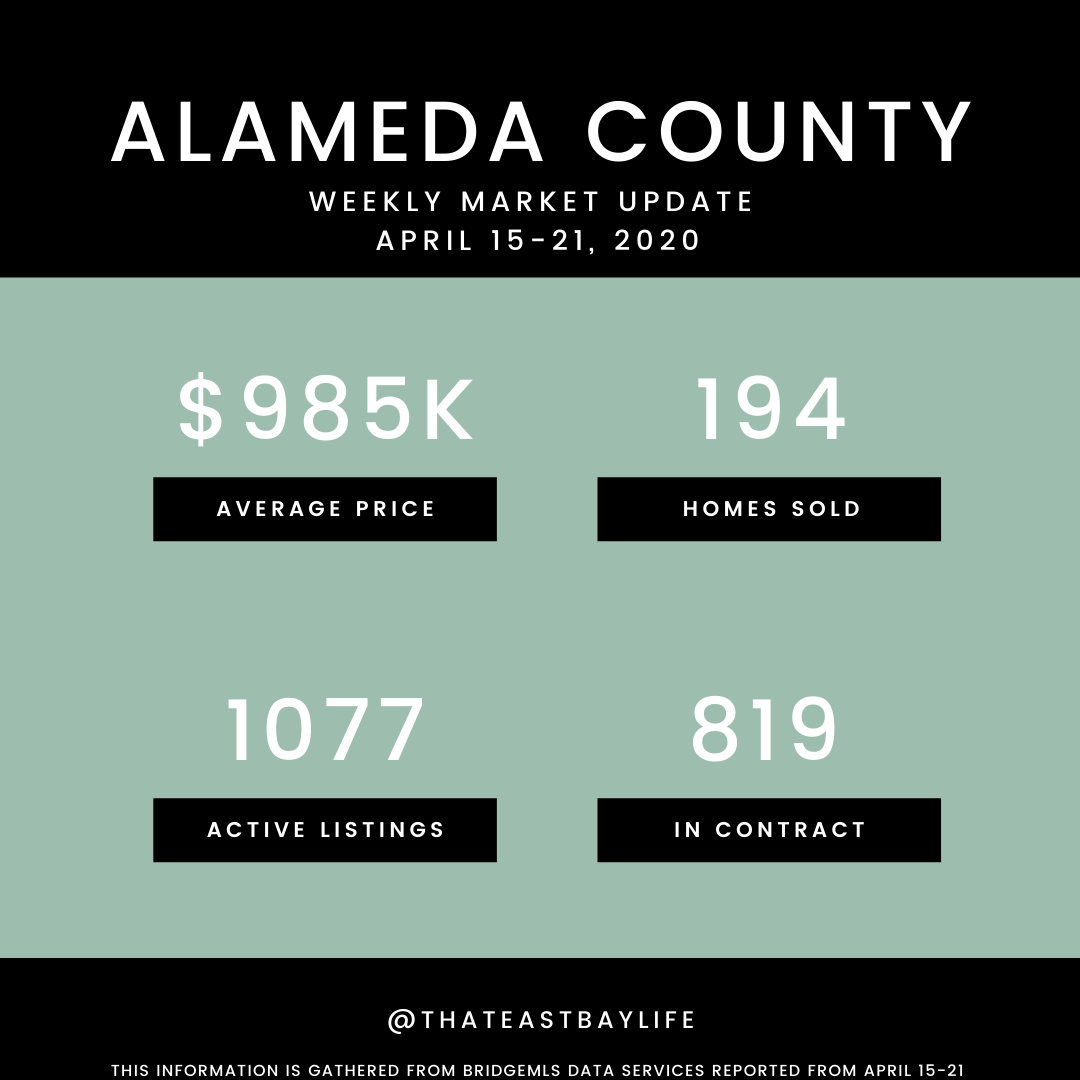
Here's your weekly market update.
Curious about what these numbers mean for you and your situation? Want to know details about your specific neighborhood? Reach out to me at simone@simonekoga.com


This heat map compares 2013 2nd quarter or 1st half median home sales prices – for houses, condos, co-ops and TICs combined, as reported to MLS – with those at the peak value time prior to the recent market recovery. Previous peak value times vary by neighborhood: typically, the least affluent neighborhoods hit peak prices in 2006 and also fell the most, percentage-wise, during the crash, falling 25% to 50%. These neighborhoods were most affected by the subprime and distressed-property sales crises. The mid-affluent neighborhoods peaked in 2007, and usually declined in value in the 20% to 25% range. And the most affluent areas reached peak values last, in the first-half of 2008 prior to the September 2008 crash: Their fall in value ranged approximately 15% to 20% from 2008 peak to 2010-2011 nadir.
Generally speaking, when the market began to turn around in late 2011/early 2012, the last neighborhoods to fall were the first to recover, followed by the mid-affluent and then the less affluent areas. All the city’s neighborhoods have made dramatic recoveries through the second quarter of 2013, but some have surged far above previous peak median sales prices and they are the red and orange colored zip codes on the map: South Beach and Yerba Buena (94105), Inner Mission and Bernal Heights (94110), the greater Noe Valley- Eureka Valley-Cole Valley area (94114 & 94117) and perhaps some of the old-prestige, northern neighborhoods (whose data is less definitive). Ochre and yellow delineate smaller increases over previous peak prices, 5% - 12%. The light-green areas, such as most of the Sunset, Parkside and Richmond districts, are back in the general range of their 2007 peak values, maybe a tad over. And the southern, blue-tinted neighborhoods are still 10% to 25% below their 2006 prices (but, like other areas, rising rapidly). Bayview (94124) is furthest below its peak, but then, with about a 50% decline, it saw the steepest drop in the city, market peak to market bottom.
Zip codes mapped white signify there wasn’t enough dependable data for a reliable analysis.
There are two different reasons for the large disparities between the zip codes: the first is that some neighborhoods are experiencing particularly white-hot buyer demand, especially by affluent high-tech buyers. The second reason is that different neighborhoods have greater amounts of decline to recoup. Those neighborhoods which declined the most in value simply have more ground to make up to get back to where they were before the market crash.
Note that if a property declined in value by 50%, it then has to go up in value 100% to get back to where it was: percentage decreases and percentage increases are not created equal.
According to Case-Shiller, the upper third of unit sales, over $760,000, is getting close to or has again reached peak values (or, in the case of San Francisco, surpassed their peaks), so significant portions of affluent Marin and San Mateo counties would be green or close to green. Marin and San Mateo have lately been trading the title for the California county with the highest median home sales price, with May-June medians of about $1,000,000. (San Francisco’s median price is pulled down somewhat by its large percentage of condo/TIC sales. Looking just at SF house prices, the overall median price in the second quarter was about $997,000 – but there are huge variations by neighborhood, ranging from under $500,000 to $4,000,000.)
And in the most sought-after communities in the heart of Silicon Valley, such as Palo Alto, there would probably be pockets of yellow-orange. Unfortunately, our access to historical sales data there is not as easy or comprehensive as we would prefer, but that is our best guess.
Our most recent Case-Shiller Index report, with price charts, can be found here: San Francisco Metro Area Case-Shiller Index
Though the rebound in home prices is occurring virtually everywhere in the country, San Francisco has been at the leading edge of the turnaround. Generally speaking, the city peaked in value last, recovered first and is rebounding most dramatically.

We've just completed our semiannual review of SF house and condo values by average and median prices, average size and average dollar per square foot for sales occurring September 1, 2012 - February 28, 2013, as reported to MLS.
The maps contain median sales price data only, while the tables include the full range of value statistics. (The tables are easier to read, but they're not as colorful.) If a price is followed by a "k" it references thousands of dollars; if followed by an "m", it signifies millions. Remember that medians and averages are very general statistics.
Further down in the newsletter are charts tracking supply and demand dynamics and price appreciation trends for the city's residential real estate market. Statistical definitions can be found at the very bottom. For the smaller images, you'll need to click-to-expand them to really make them decipherable.

click for larger image
|
4-Bedroom House Values This is the table for 4-bedroom house sales over the past 6 months. This link goes to the full analysis by property type, neighborhood and bedroom count. Neighborhood, Property Type, Bedrooms |

click for larger image
|
2-Bedroom Condo Median Price Map A map of median sales prices for 2-bedroom condos around the city. The table in the full analysis provides further statistical measures. Full Analysis |

click for larger image
|
Trends in Inventory & Sales Volume Sometimes there's nothing like a chart to depict trends. Here one can clearly see the drastic decline in inventory. And this link goes to a chart on Months Supply of Inventory, another statistic of supply and demand: Months Supply of Inventory |

click for larger image
|
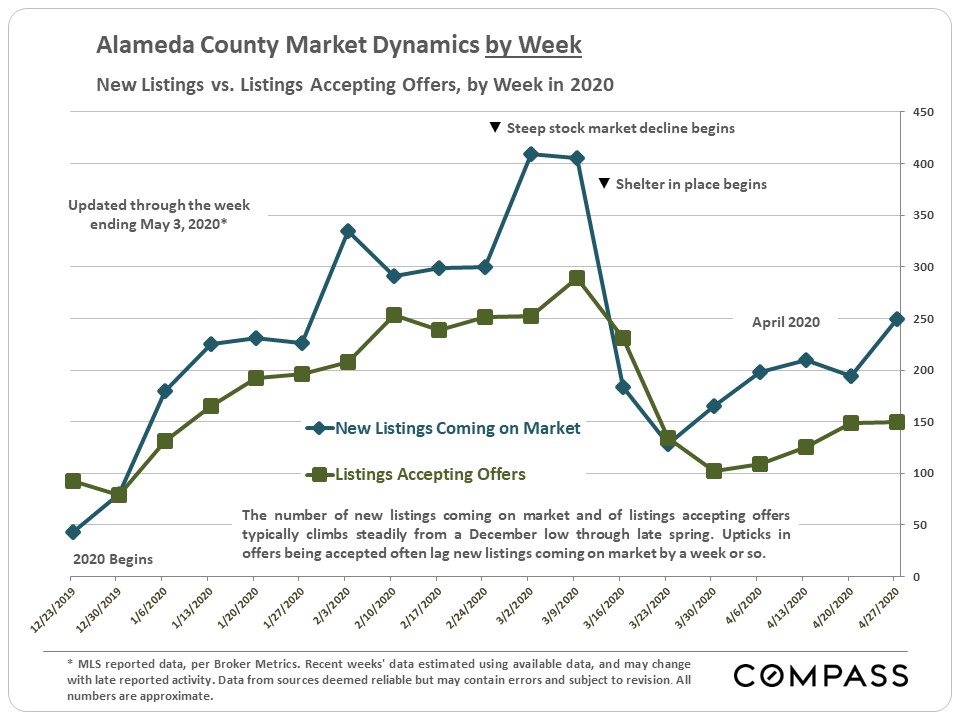
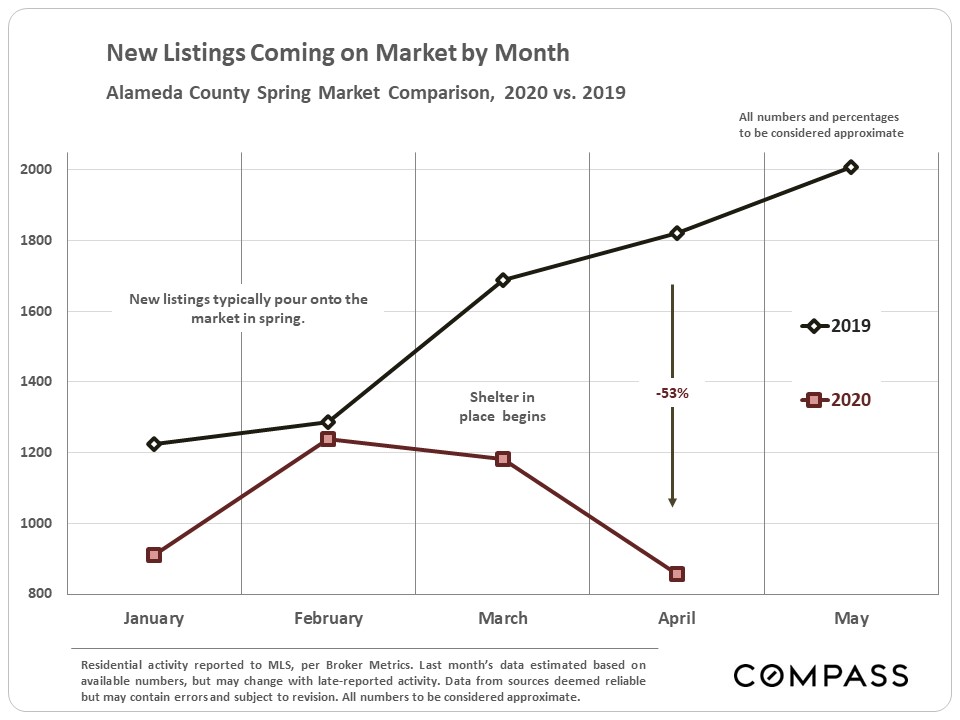
New Listings Coming on Market The quantity of new listings ebbs and flows by season, however even accounting for seasonality, the number of new listings coming on market is much lower than usual. And this link shows the increasing demand since the market recovery really got underway in 2012: Percentage of Listings Accepting Offers |

click for larger image
|
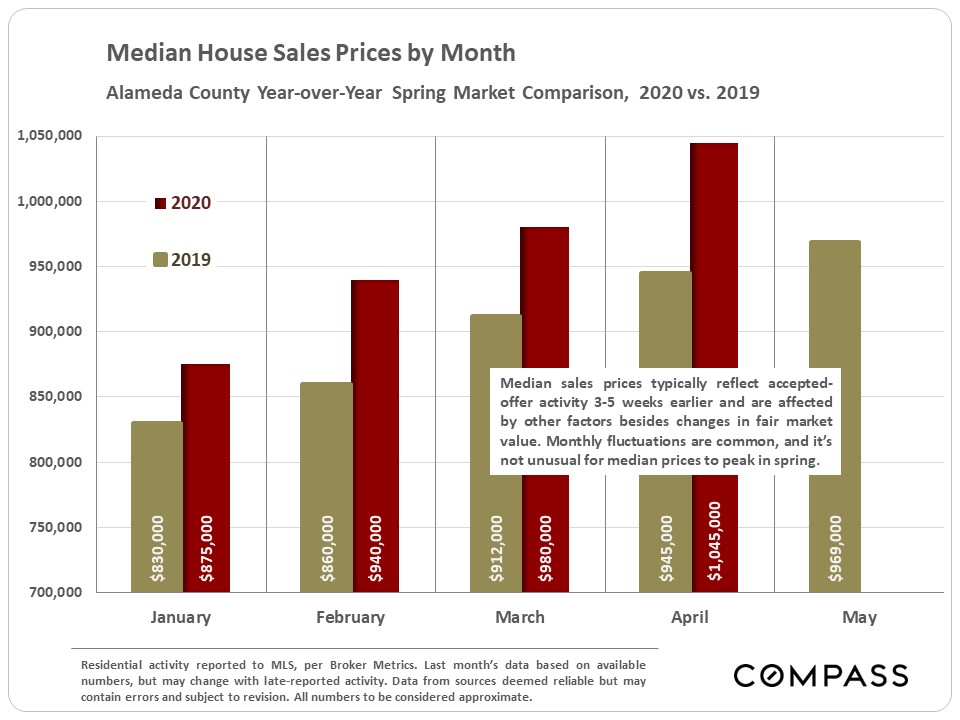
Median Price Trends by Month Monthly price data often fluctuates due to a variety factors. For example, median and average prices almost always drop in January since the higher end of the market usually checks out for the holidays: Values haven't changed; the demographic of buyers and available inventory changed. However, the clear upward trajectory of prices over the past year is clear in both median and average sales prices. Average Price Trends |
The MEDIAN SALES PRICE is that price at which half the properties sold for more and half for less. If there were 3 sales, at $1, $2 and $10, the median price would be $2. If there were 4 sales at $2, $2, $5 and $10, the median would be $3.50. Median sales price may be affected by seasonal trends, and by changes in inventory or buying trends, as well as by changes in value.
AVERAGE DOLLAR PER SQUARE FOOT is based upon the home's interior living space and does not include garages, storage, unfinished attics and basements; rooms and apartments built without permit; decks, patios or yards. These figures are typically derived from appraisals or tax records, but can be unreliable, measured in different ways, or unreported altogether: thus consider square footage and $/sq.ft. figures to be very general approximations. Generally speaking, about 60-80% of listings report square footage, and dollar per square foot statistics are based solely on those listings. All things being equal, a house will have a higher dollar per square foot than a condo (because of land value), a condo will have a higher $/sq.ft. than a TIC (quality of title), and a TIC's will be higher than a multi-unit building's (quality of use). All things being equal, a smaller home will have a higher $/sq.ft. than a larger one. The highest dollar per square foot values in San Francisco are typically found in upper floor condos in prestige buildings with utterly spectacular views.
The AVERAGE SIZE of homes of the same bedroom count may vary widely by neighborhood: for example, the average size of a 4-bedroom house in Pacific Heights is much larger than one in Noe Valley; and the average of a Marina 2-bedroom condo is larger than one in South Beach. Besides the affluence factor, the era and style of construction often play large roles in these disparities.
Some neighborhoods are well known for having additional ROOMS BUILT WITHOUT PERMIT, such as the classic 1940's Sunset house with "bedrooms" and baths built out behind the garage. These additions often add value, but being unpermitted are not reflected in $/sq.ft. figures.
Many aspects of value cannot be adequately reflected in general statistics: curb appeal, age, condition, views, amenities, outdoor space, "bonus" rooms, parking, quality of location within the neighborhood, and so forth. Thus, how these statistics apply to any particular home is unknown.
All information herein is derived from sources deemed reliable, but may contain errors and omissions, and is subject to revision. © Paragon Real Estate Group, March 2013
|
More condos sell in San Francisco's South of Market (SoMa), South Beach, Yerba Buena and Mission Bay neighborhoods than anyplace else in the city: This is where by far the greatest number of new condos has been built in the last 20 years. The market here heated up very rapidly in 2012, especially as the number of brand new condos on the market has dwindled (contributing to the severe inventory crunch). This area is one of the world centers for high-tech and bio-tech businesses and homebuyers, and the ferocious demand competing for the very limited inventory have caused prices to jump dramatically.
Luxury condos here, in high prestige buildings, typically with spectacular views, sell for among the highest dollar per square foot values in the city. The largest sale reported to MLS in 2012 was $7,850,000 for a unit at the Millennium.

**************************************
Sales by Price Range

Long-Term Trends in Values
The following charts track average sales price and average dollar per square foot for non-distressed condo sales by year since 1995, specifically for the South Beach/Yerba Buena and SoMa neighborhoods. Remember that average sales price is different from median sales price (which is used more often), but is just another way to look at long-term market trends.
Here, we've limited the analyses to sales under $1,800,000: though this area has a large luxury component, the very high-end sales generally distort the averages for the vast majority of sales.


Sales Over, Under and At List Price
As the market gets hotter, the percentage of listings selling for over asking price increases.

Median Sales Price Trends for 2-Bedroom Condos
A comparison of Median Price trends for 2-BR condos in 5 of the city's neighborhoods. All 5 have been showing median price appreciation, but none more so than the South Beach and Yerba Buena neighborhoods.

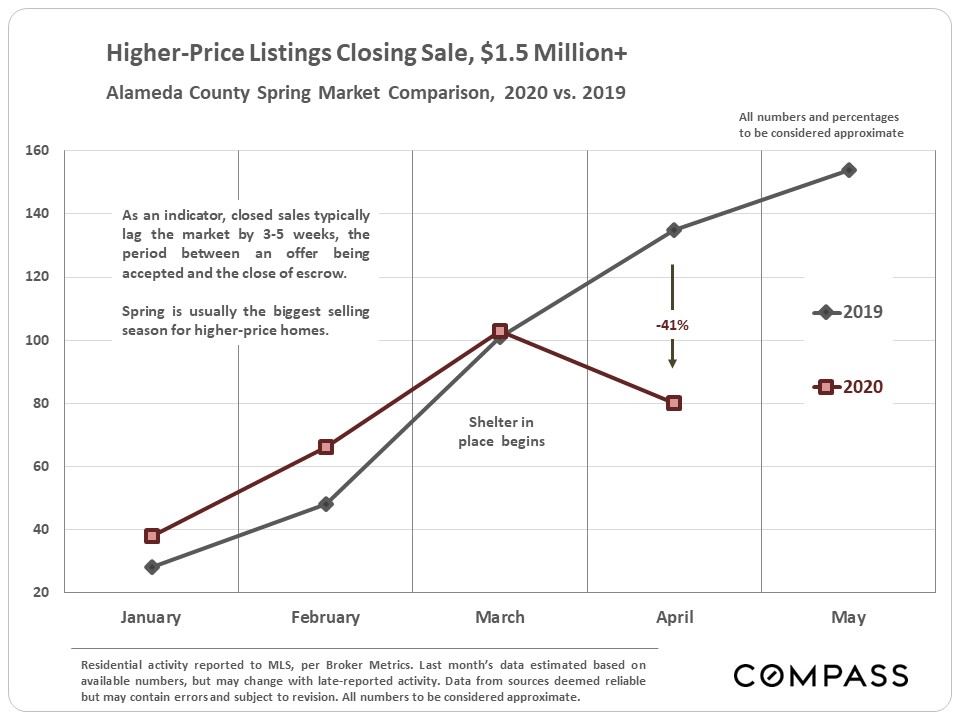
Number of Listings Sold
Very strong unit sales numbers in recent quarters and they would have been significantly higher if there were more listings available to buy. Distressed condo sales are rapidly declining as the market recovery has gained momentum.

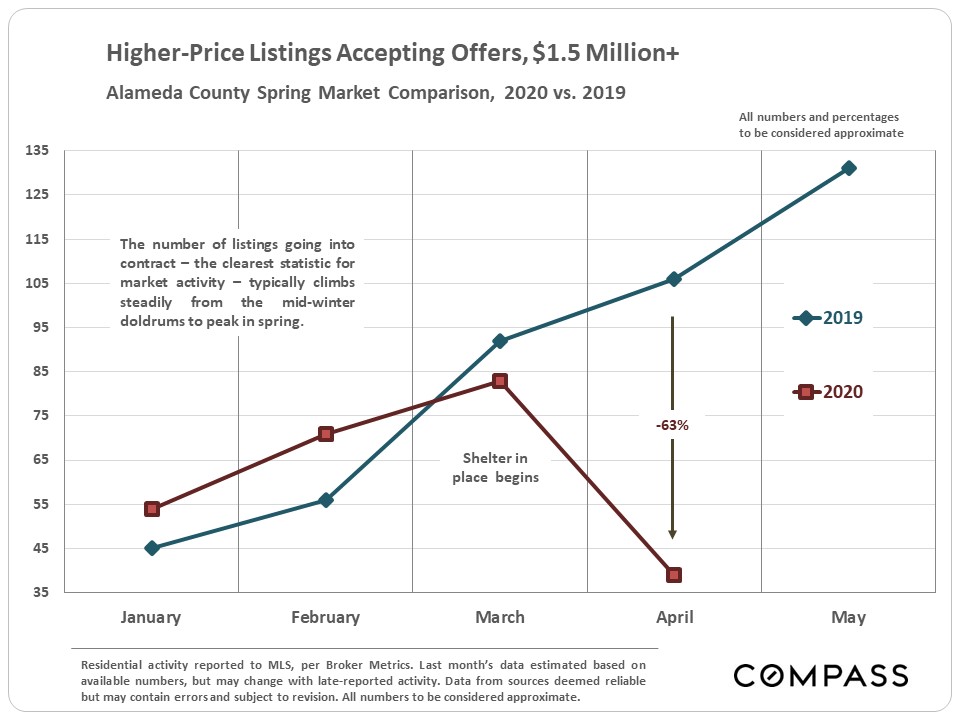
Percentage of Listings Accepting Offers
An excellent statistic for measuring buyer demand against supply of inventory. The percentage is now at the highest point in memory.

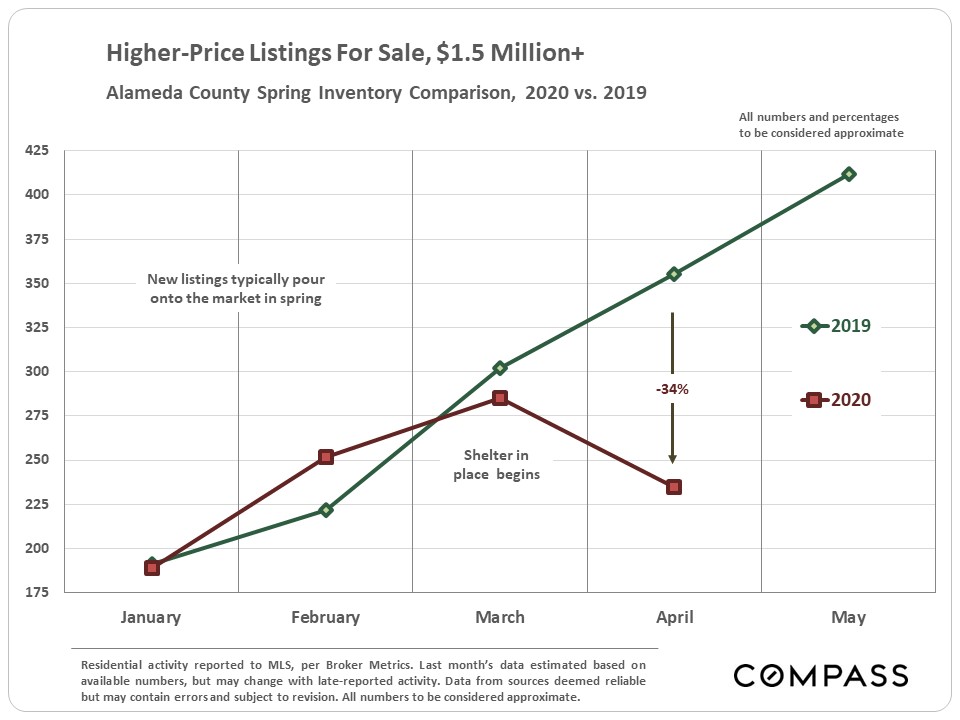
Condos for Sale
The inventory of condos listed for sale through MLS is far below that of previous years and is seriously inadequate to meet market demand.

The New-Development Condo Market
The vast majority of new-condo construction over the past 15 years has been in this greater area: it's been estimated that over 10,000 were built here in the first 10 years of the century. The 2008 financial crisis caused new condo construction to crash in SF, which led to large declines in new-condo listings and sales. Now, new construction is recovering in a big way -- many big new projects are planned by some very well-known developers -- but it will probably take about 2 years, more or less, before we see a large quantity of newly built condos coming on the market.

Months Supply of Inventory (MSI)
The lower the MSI, the stronger the demand as compared to the supply of homes for sale. MSI readings this low -- below 2 months - is considered to be indicative of a strong "Seller's Market."

Condo Sales $1,000,000 & Above
The number of condos selling for $1m and above is at its highest point in years: Sales increased in the 4th quarter even as inventory fell. Demand for higher-end condos in the best buildings is quite competitive now.

Distressed Condo Listings & Sales in the Greater SoMa Area
Because so many large developments were built here in the last 15 years, this area had more distressed condo sales (bank-owned property sales and short sales) than any other area of the city. However, the number of distressed listings and sales has been rapidly declining with the market turnaround and looks to disappear completely in the near future.


District 5 is one of the more homogeneous districts in San Francisco in terms of property values, but still any analysis of an area with so many properties of different type, location, condition and quality can only be a very general overview.
District 5 soared in value between 1996 and 2008 and was one of the last districts to peak in value before the financial markets meltdown in September 2008. Values then fell 15% to 20% very quickly and then stabilized in 2009 and 2010. With the surge in high-tech buyers in 2011 (among other economic factors), many of whom wish to be close to highways to the peninsula -- and love the lifestyle and ambiance of District 5 neighborhoods and its commercial districts -- activity in this district picked up dramatically.
In 2012, the competition between qualified, motivated buyers here became ferocious: inventory is very low, certainly not enough to satisfy buyer demand, and many of the listings are selling very quickly in multiple-offer, competitive-bidding situations. This is exerting considerable upward pressure on prices.
If you adjust your screen view to a 125% zoom, the charts will be that much easier to read. On Windows systems, pressing the Control and + keys simultaneously should do this quickly.

Home Sales by Price Range A snapshot of number of sales by price segment in 2012.

Average Sales Prices & Average Dollar per Square Foot The two statistics of value in the charts following -- average sales price and average dollar per square foot -- can change depending on a number of market factors, but the general price trend over the past year or so is clearly upward. High demand plus low supply equals higher prices. When neighborhoods are grouped together below, it is because they generally share similar market values in particular property types. Annual statistics, because of the much greater amount of data, are typically more reliable than (fluctuating) quarterly or monthly stats, however when a market is changing quickly, as it has in 2012, annual data will minimize market changes (which is why the charts show statistics from the latter part of the past year).


Luxury Home Sales Higher end home sales in the Noe Valley, Eureka Valley, Cole Valley and associated neighborhoods of Realtor District 5 dramatically surged in 2012. Though prices are still significantly lower than in the old-prestige, northern neighborhoods such as Pacific and Presidio Heights, this area is playing a greater and greater role in luxury home segment. High-tech buyers are definitely playing a major role in this dynamic.


Percentage of Listings Accepting Offers
An excellent statistical snapshot of supply and demand. As the market heated up, the percentage started climbing higher in 2011 and is now at its highest level in memory.

Price Reductions, Sales Price to List Price Percentage, and Days on Market Right now, the great majority of the homes that sell in District 5 now accept offers quickly before any price reductions are necessary and on average go well over asking price. However, those listings that go through one or more price reductions take much longer to sell and sell at a large discount to original list price. No matter what the market, proper pricing is a vital issue in the sale of real estate.

Homes for Sale on the Last Day of the Month
The drastically low inventory of homes available to purchase in this area is clearly illustrated in this chart.

Months Supply of Inventory (MSI) MSI is at an extremely low level of inventory for houses and condos, a reading that would be considered indicative of a very strong "Seller's Market." Indeed anything under 3-4 months is usually considered a Seller's Market.

Average Days on Market (DOM) Before Acceptance of Offer
These figures can fluctuate without great meaningfulness -- a few listings that sell after being on the market for a long time can have a large impact on the average, even when new listings are selling very quickly -- but the trend can be interesting. Right now, many listings are accepting offers within 7-14 days of going on market.

|
||||||||||||||||||||||||||||||||||||||||||
|
||||||||||||||||||||||||||||||||||||||||||
|
|||||||||||||||||||||||||||||||||||||||||||||||||||||||
|
|||||||||||||||||||||||||||||||||||||||||||||||||||||||
|
||||||||||||||||
|
||||||||||||||||
|
||||||||||||||||
|
||||||||||||||||
|
||||||||||||||||||||||||||||||||||||||||||||||||||||||||||||||||||
|
||||||||||||||||||||||||||||||||||||||||||||||||||||||||||||||||||
|
||||||||||||||||
|
||||||||||||||||
|
||||||||||||||||
|
||||||||||||||||
|
||||||||||||||||
|
||||||||||||||||
|
||||||||
|
||||||||
|
|||||||||||||||||||||||||||||||||||||||||||||||||||||||||||||
|
|||||||||||||||||||||||||||||||||||||||||||||||||||||||||||||
|
||||||||||||||||
|
||||||||||||||||
|
||||||||||||||||
|
||||||||||||||||


 More information here


 Trends in Median Sales Prices for Non-Distressed 2-Bedroom Condos
in Selected SF Neighborhoods2012 Numbers reflect 2nd Quarter Sales Only
Trends in Median Sales Prices for Non-Distressed 2-Bedroom Condos
in Selected SF Neighborhoods2012 Numbers reflect 2nd Quarter Sales Only


